|
SIMPLIFIED STRATEGY
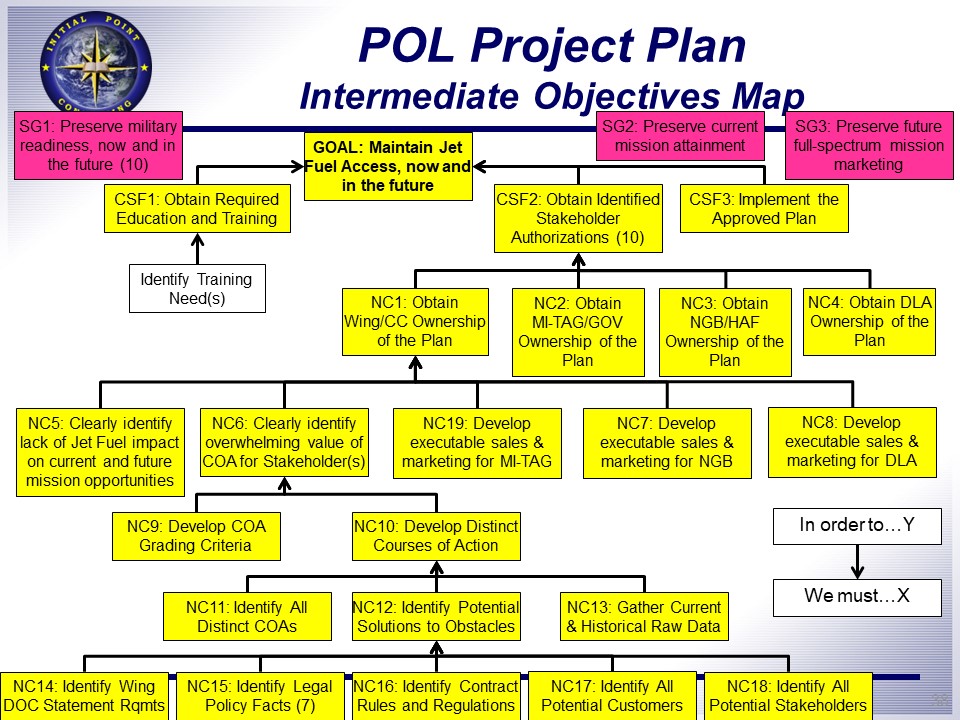
A variation on LTP is the use of three tools together in the ID/IO Simplified Strategy. (2) The first is the Interference Diagram, an intuition-based tool to surface obstacles to the goal. This tool allows the user to quickly identify the general direction of actions and make rapid progress toward success. The major client challenge was to maintain generic statements that allowed for objective investigation of the full range of options. The second tool is the Intermediate Objective Map, a logic-based tool used to organize identified actions into Necessary Conditions that achieve Critical Success Factors essential to success. This step does not regard the time-phasing of actions but looks at identification of the progression of dependency to attain the goal. Although Sproull mentions building the Plan of Action, the IO Map may morph into a Prerequisite Tree (PRT) or Plan of Actions and Milestones to create the roadmap for project management. Here the Necessary Conditions are depicted in Yellow, Critical Success Factors in Magenta, and the point at which identified Obstacles are overcome in Red stop signs. Critical Chain Project Management can now begin to realize the identified goal. Depicted is the culmination of the Interference Diagram, Intermediate Objective Map, and Project Management development. |

FEVER CHART
A fever chart provides a visual representation of buffer utilization for continuous identification of challenges to on-time delivery. Managers at all levels can quickly determine if buffer utilization is on-target requiring no intervention, increasing requiring planning to return to planned use, or critical requiring the implementation of corrective plans.
Example Coming Soon
|
|
PROJECT MANAGEMENT
Every project has milestones that must be synchronized with other dependent tasks to ensure success. Mapping these tasks and determining the critical path or Critical Chain ensures program flow from inception through continuous improvement. About this project:
We facilitated annual manpower savings (reduction and rotation/move expense) of $17.9M+ per year while improving the customer system to retain product quality and timeliness. We created and conducted a realistic hands-on exercise to train our customer in only 4 months, a process that normally takes 15-18 months in the Joint Exercise Life Cycle. By focusing on the constraint and subordinating all other tasks to the critical chain we decreased lead time by 78%. Developing a capstone experiential learning event required close management of logistics and milestones to ensure success. Tailored products provided the benchmark for future efforts and reduced administrative and management efforts that allowed our customer to identify and correct deficiencies of a mandatory redesign. For more information about this project, see our "Experiential Learning" page. |